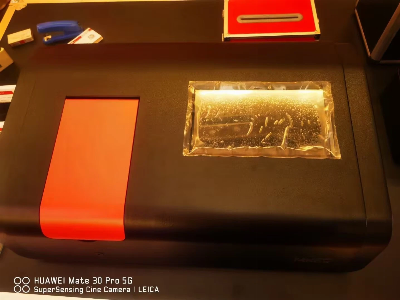
Product Description Exhibition Product
Parameters Wavelength range:320~1100nmSpectral
Bandwidth:2nmWavelength accuracy:±0.5nmWavelength
Reproducibility:≤0.2nmTransmittance accuracy:±0.3%τTransmittance
Repeatability:0.15%τStray light:≤0.04%τ(340nm
NaNo2)Stability:0.001A/h(500nm
Preheated)Metering:AutomaticWavelength tuning:Transmittance,
absorbance, concentration, energy(T,A,C,E)Photometric
range:-0.3~3ADisplay:Touch LCD Screen 7 inchesDetector:Imports of
silicon photodiodeSource:Imports of tungsten lampPower
supply: AC 220V/50Hz,110V/60HzPower:120WInstrument
Size:480×350×220mmNet weight:11Kg Drug analysis:National
Formulary" Available UV-visible spectrophotometry drugs for drug
testing, drug analysis, pharmaceutical and other industriesLife
Sciences:DNA, protein concentrationAnimal husbandry and
fishery:Pesticide residues, crop composition testing, veterinary
testing, feed testing, fertilizer testing, soil composition
testing, testing and other aquacultureMetal elements:Ag Cu Pb Zn Co
Ni K Na Ca Mg Li Mn Cr As, including precious metalsGeological
Survey:Determination of metal elements in minerals and inorganic
saltsFood safety:Content of additives, preservatives, perfumes,
fats, enzymes, sugars, spices, minerals, vitamins,
etc.Environmental monitoring:Monitoring water, air, rainfall and
soil, etc., in which the determination of various pollutants
OURRESARCH & DEVELOPMENT The
Company COPMANYOUR COPMANYCompetitive
Advantages Single-chip microcomputer control,
Touch 7inches LCD ScreenThe large LCD monitor can display multiple
sets of dataHuge memory space to store multiple sets of data and
curvesAutomatic transfer 0, transfer 100% functionalAutomatic
wavelength adjustmentFilter automatic switchingLarge sample pool
(5mm~100mm)With up to 10 standard sample for measurement function
of standard curve establishBy direct input K, B factor to establish
a standard curve for quantitative measurementMaster Standards can
be directly input and the corresponding concentration values
establish a standard curve for quantitative measurementStandard
curve parameters can be powered down to save the measurement
setupUniversal parallel interface, you can print the title bar, the
measured data, curve parameters, curve standard sample points and
curvesWith USB InterfaceSpectrum scanning can be achieved through
the PC software control is more precise and flexible measurement
requirements (optional) /* March 10, 2023
17:59:20 */!function(){function s(e,r){var
a,o={};try{e&&e.split(",").forEach(function(e,t){e&&(a=e.match(/(.*?):(.*)$/))&&1
Related products about Determination of Silica in Refractories 7 Inches Touch Screen UV-Vis Spectrophotometer
-
 Waste Tyre Plastic Recycling Machinery Machine Tire Crusher Production Line Rubber Crumb Grinding Machine Equipment Tire Shredder
-
 Stretch Plastic Blowing Pet Bottle Making Blow Molding Machine Bottles Stretch Automatic Pet Bottle Blowing Machine
-
 Waste Plastic Pet Bottle, Water Bottle Flake, PP/HDPE/LDPE PE Film Jumbo Woven Bags Plastic Crusher Machine, Plastic Crushing Washing Recycling Machine
-
 Type 2 Wall-Mounted Electric Car Charging Station 7kw /11 Kwelectric Vehicle Charging Station Home Wallbox AC EV Charger Single Phase or 3three Phase
-
 G-View G12W Wholesale Auto Car LED Headlight Bulb High Power H13 H11 9005 H7 H4 Car LED Headlights LED Car Lights
-
 New Design Porcelain Round Plates Dinner Set for Wedding and Banquet
-
 China 2023 New Design Super Soft 100% Polyester Microfiber Knitted Oversized Decoration Hoodie Blanket
-
 Handmade Art Creative Materials Thickened White Paper Cup DIY Disposable Handmade Colored Paper Cup


